The following example shows how you can create a LineChart in Flex by using static data from an array. The chart is created in MXML without any ActionScript code. The example shows you how you can create a simple animated chart without knowing ActionScript (with ActionScript you can create more dynamic and interactive charts, but for beginning this is the simplest aproach).
In order to do this example, you need Adobe Flash Builder 4 (if you are a student, faculty or staff of eligible educational institutions, you can benefit from the Free Flex for Education program)
1. Start Adobe Flash Buider 4 (or Adobe Flex Builder 3) and select New –> MXML Application
2. Name the application, LineChartExample, and select a vertical layout for it (the components will be displayed one after each other)

3. The default MXML structure of this application is (you can see it in Source Window):
4. Define the data as an array. After the </fx:Declarations> tag add the declaration
As you can see, there are 2 lists. Each list has 8 elements, which represents pair values for a date and a value. For example, {Month:”22 nov”, value:4.1274}, represent an element from the array that has 2 values. String values are placed between “ ”. Each element of the array is separated by , (comma)
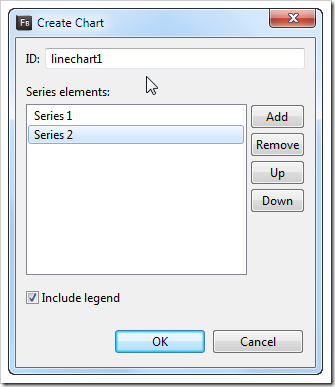
5. Add the line chart. There are 2 ways to do that:
-
from Design mode select the Line chart component and drag it on the scene; after that set the 2 series elements and the legend

- in the MXML source add after the </fx:Script> ending tag:
6. Make the connection between the line series and the data series by adding to the <mx:lineseries…/> tag the dataProvider property; also indicate the value to use from the array with the yField property; the line series become:
7. Add the horizontal axis and bind it to the month value from the first data series. The <mx:horizontalAxis> is added between <mx:LineChart> and </mx:LineChart>
8. Set the minimum and maximum values for the vertical axis by adding <mx:verticalAxis> tag between <mx:LineChart> and </mx:LineChart>:
9. Add data tips on the chart that are showed when the user cursor intersects the chart lines. Modify the <mx:LineChart> tag like this:
10. You can modify the default color of a line, whith the <mx:lineStroke> tag like this:
11. The chart is tested by Run command (Run –> Run LineChartExample from menu or CTRL + F11)
[kml_flashembed publishmethod=”static” fversion=”10.0.0″ useexpressinstall=”true” movie=”http://www.itcsolutions.eu/wp-content/uploads/2010/12/LineChartExample.swf” targetclass=”flashmovie” loop=”true”]

[/kml_flashembed]
The source file for this example can be downloaded from Line Chart Example – MXML source